


A Temperature Map of Tempel 1
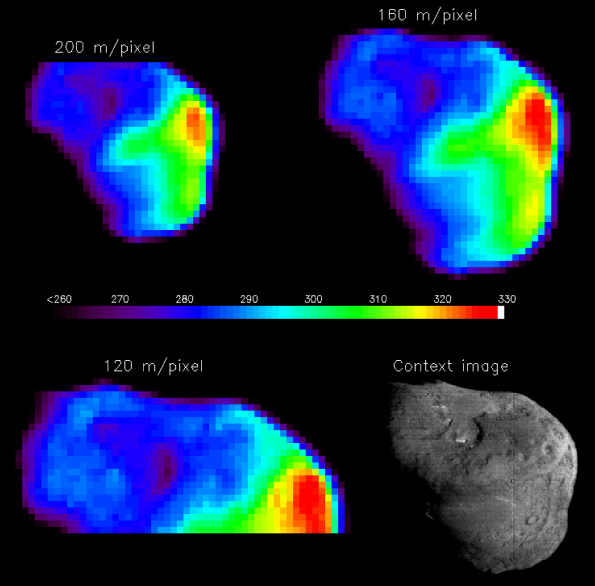
A temperature map of the nucleus with different spatial resolutions. The context image (in black and white) is a HRIVIS image taken just before impact. The color bar in the middle gives temperature in Kelvins. The sun is to the right in all images.
These data were acquired with the IR spectrometer using signal between 1.8 and 2.2 µm and modeled to contain both a reflected and an emitted component. After this model is applied, the resulting number is a temperature which is represented by different colors with red being the highest and purple the coldest.
The derived temperature varies from 260 +/- 6 K to 329 +/- 8K. Shadows are the coolest temperatures, and the point directly below the sun is hottest. These temperatures indicate that the thermal inertia of the surface (the quality of the surface describing the ability to conduct and store heat) is low. In other words, on Tempel 1, it is hot in the sun and cold in the shadows. A value for thermal inertia is estimated at <100 W/K/m2/s1/2.
CREDIT: NASA/UM M. F. A'Hearn et al., Science 310, 258 (2005); published online 8 September 2005 (10.1126/science.1118923). Reprinted with permission from AAAS. Permission to reproduce.
You may think you've seen this before. But you have only seen this color table used before. The image of Comet Tempel's Silhouette uses the same color table, but as the figure caption points out, the color represents brightness intensity and NOT temperature.
This leads us to an important point about interpreting color in a digital image: Read the figure caption carefully to understand what the color is representing.
For more information, see the article Creating Colorful Comets by Noah Goldman.
Meet Olivier Groussin, Science Team member.