


First Spectra from Deep Impact's Infrared Spectrometer
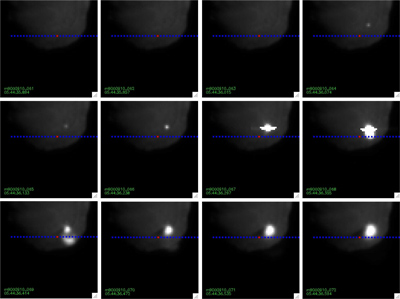
We acquired 3835 spectra with the IR spectrometer from June 29 - July 14. We have analyzed a handful of them. At impact, the spectrometer's slit was positioned downrange of the impact site and we had programmed the instrument to take data as rapidly as possible to get the best time resolution. The red dot in Fig. 1 identifies the location of the first series of spectra that have been presented at meetings by Jessica Sunshine, Co-Investigator from SAIC in Herndon, VA.
With the passage of time, material traveled across the slit. The first spectrum shown in red, shows a combination of reflected light, from 2.0 to about 3.0 µm, and emitted light from 3 -4.5 µm, that was taken just before impact.
A spectrum taken 0.6 s after impact, is shown in green. It covers an area roughly 85 meters (278 feet) on a side, centered half a kilometer (1640 feet or 5.5 football fields) down range from the impact and displaced off the downrange line by a little more than a third of a kilometer (1093 feet or about 3.6 football fields). Emission lines of H2O (water), HCN, CO2 and C-H stretching mode (organics) vibrations are seen. A modelled spectrum including water and carbon dioxide is plotted in blue. The temperature of water and carbon dioxide in the modeled spectrum is 1400 K, though values between 1000 K and 2000 K are also valid. This is hot material from the vapor plume. A dramatic change in the abundance of the C-H emission feature is seen that was not expected. The temperature of the background thermal emission is 850K in the modeled spectrum. We did not model the C-H, organic emission bands.
We are looking at the changes in the spectrum over time and comparing pre- and post-impact spectra. More results will be presented next month.
 |
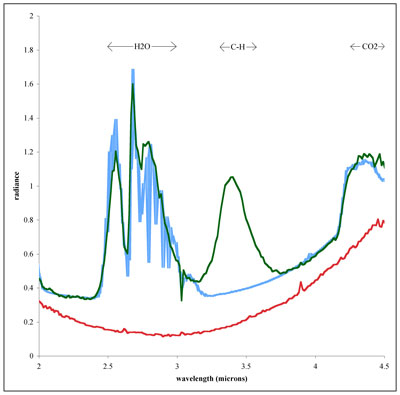 |
Fig. 1 - MRI images showing the location of the spectrometer's slit (blue) and the position of the spectrum shown in Fig. 2 shown by the red dot.
(Click here for larger view) |
Fig. 2 - Infrared spectrum of Comet Tempel 1. Vapor plume shown in green 0.6 seconds after impact. Blue spectrum is modelled with water and carbon dioxide at 1400K and thermal emission at 850K with no presence of organics between 3.3 and 3.6 µm. Red spectrum is taken 0.7 sec earlier than the green one.
(Click here for larger view) |
Credit for Both Images: NASA/JPL-Caltech/UM M. F. A'Hearn et al., Science 310, 258 (2005); published online 8 September 2005 (10.1126/science.1118923). Reprinted with permission from AAAS. Permission to reproduce